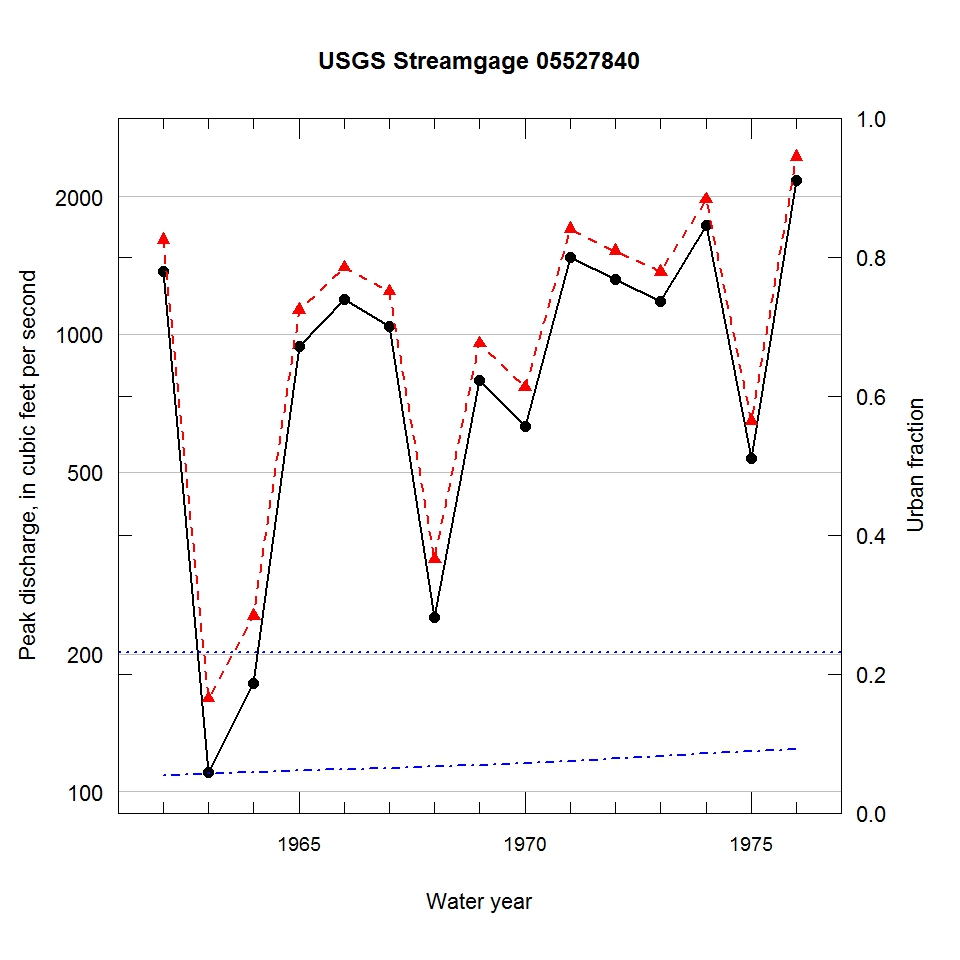
Observed and urbanization-adjusted annual maximum peak discharge and associated urban fraction and precipitation values at USGS streamgage:
05527840 DES PLAINES RIVER AT WADSWORTH, IL


| Water year | Segment | Discharge code | Cumulative reservoir storage (acre-feet) | Urban fraction | Precipitation (inches) | Observed peak discharge (ft3/s) | Adjusted peak discharge (ft3/s) | Exceedance probability |
| 1962 | 1 | -- | 0 | 0.054 | 0.153 | 1370 | 1610 | 0.178 |
| 1963 | 1 | -- | 0 | 0.057 | 1.532 | 110 | 160 | 0.990 |
| 1964 | 1 | -- | 0 | 0.059 | 0.695 | 173 | 242 | 0.970 |
| 1965 | 1 | -- | 0 | 0.061 | 0.532 | 940 | 1130 | 0.405 |
| 1966 | 1 | -- | 0 | 0.063 | 0.526 | 1190 | 1400 | 0.257 |
| 1967 | 1 | -- | 0 | 0.065 | 1.484 | 1040 | 1240 | 0.343 |
| 1968 | 1 | -- | 0 | 0.067 | 0.473 | 240 | 322 | 0.948 |
| 1969 | 1 | -- | 0 | 0.069 | 1.206 | 795 | 955 | 0.534 |
| 1970 | 1 | -- | 0 | 0.071 | 1.621 | 630 | 766 | 0.685 |
| 1971 | 1 | -- | 0 | 0.075 | 0.271 | 1470 | 1700 | 0.156 |
| 1972 | 1 | -- | 900 | 0.078 | 0.584 | 1320 | 1520 | 0.203 |
| 1973 | 1 | -- | 900 | 0.082 | 1.460 | 1180 | 1370 | 0.274 |
| 1974 | 1 | -- | 900 | 0.085 | 0.523 | 1730 | 1970 | 0.096 |
| 1975 | 1 | -- | 900 | 0.089 | 0.307 | 535 | 646 | 0.775 |
| 1976 | 1 | -- | 900 | 0.092 | 1.220 | 2170 | 2440 | 0.051 |

